

Content of the Presentation
1. Background
2. Introduction
3. Objectives
4. Financial Model Features
5. Current Water Tariff
6. Graphical Representation of the Model
7. Tariff simulation (5 yearly)
8. Time schedule for the Implementation
9. Appendices
2

BACKGROUND
The Financial Model was first initiated during the Author’s tenure with the
State Water Supply Department back in 1998 whereby
privatization/corporatisation of the Water Department was the most
pertinent issue, and various invitation letters were issued to potential
bidders.
It was widely recognized that a cash flow / financial model must be
developed internally in order to assist the State Government as well as
the Water Supply Department to evaluate the proposals
Hence, the author was at that time were given the task / responsibility to
develop the financial model. As water supply operator, author was able
to access the real Data necessary to construct the Model. However, the
privatisation / corporatisation of the Water Supply Department did not
materialise after much negotiation.
Nevertheless, the development of the Financial Model did not stop and
the author has since further developed and refined the financial model to
a full-fledge financial model system which provides the users with
enhanced flexibility and users-friendliness
The Financial Model was endorsed by Sabah State Government in
cabinet meeting held on May 2004.
3

INTRODUCTION
An excel-based financial model has been developed extensively to
facilitate the financial management of Water Supply Authority. It is
basically a Cash Flow program projection to 5 years and can be extend to
40 years, where IRR and NPV are used as references to adjust others
Variables to ensure the viability of the investment. As Water Supply is an
Essential Service, it should be considered as a long term business with
marginal profit.
The costs of capital works (New water treatment plant and associated
systems) have been excluded in the evaluation. These costs are usually
financed by the State Government or other government agencies. This
program will evaluate the production capacity required to satisfy future
demand for planning purpose.
We would expect that the tariff which is the main revenue from the Water
Supply System should cover the cost of Operation & Maintenance (O&M )
and Renewal ( Asset Replacement ) of water supply system. There are
some main and minor factors that affect the cost recovery, they have been
included in the model for monitoring by the Management. In the early
stage of Model implementation, Government subsidy will be required to
maintain service level. The subsidy will be gradually reduced to ease the
Government financial burden. It must be stated that there is no immediate
breakeven or cost recovery, the breakeven period largely depends on
tariff setting, collection efficiency NRW and the O&M cost. Good
Management plays important role in the exercise.
Data collection for the program input will be carried out once a year.
With the application of this Model, the Management would be more
vigilant of the situation ahead and remedial action can be taken earlier to
alleviate major future problems in Water Supply system.
4

OBJECTIVE
Proper Implementation of the Model shall assist to satisfy following
criteria/objective:
➢ Adequacy – sufficient to met the current costs of Operation &
Maintenance in a first stage and part of the capital expenditure in a second
stage of development of the model if desired
➢ Affordability – Introduction of a social tariff for low income group and
the setting up of adequate rates to promote commercial & Industry growth
➢ Enforceability – the new tariff shall be fair & reasonable for a non
controversial and easy implementation
➢ Water conservation – the new tariff shall create strong incentives for
water conservation in the state
➢ Historical continuity – To be globally in line with the trend in other
states and related to trend of model parameters variations in recent years.
5

THE MODEL’S FEATURES
6
1. The Model can be utilized for 40 years
2. It can be run for any single or multiple Divisions sharing common distribution areas.
3. Trend of NRW
4. Trend of Supply and Demand
5. Trend of Collection Efficiency
6. Trend of Water Tariff
7. Consumption pattern of various type of consumers
8. Progressive volumetric water tariff with option for future adjustment.
9. It provides continual historical data to support future Tariff adjustment.
10. Option to include Meter charge / connection / month ( for meter replacement ) if require.
11. Trend of annual Sales and Collection
12. It indicates where we are financially and the future heading
13. Budget on Government subsidize to maintain service level
14. Simulate “what if” conditions on financial system performance indicators
15. A tool to set goal for monitoring and necessary corrective action
16. To ease Government financial burden in a long run through proper planning and
development.
It can be used to monitor the physical and financial performance of the privatized /
corporatized entity
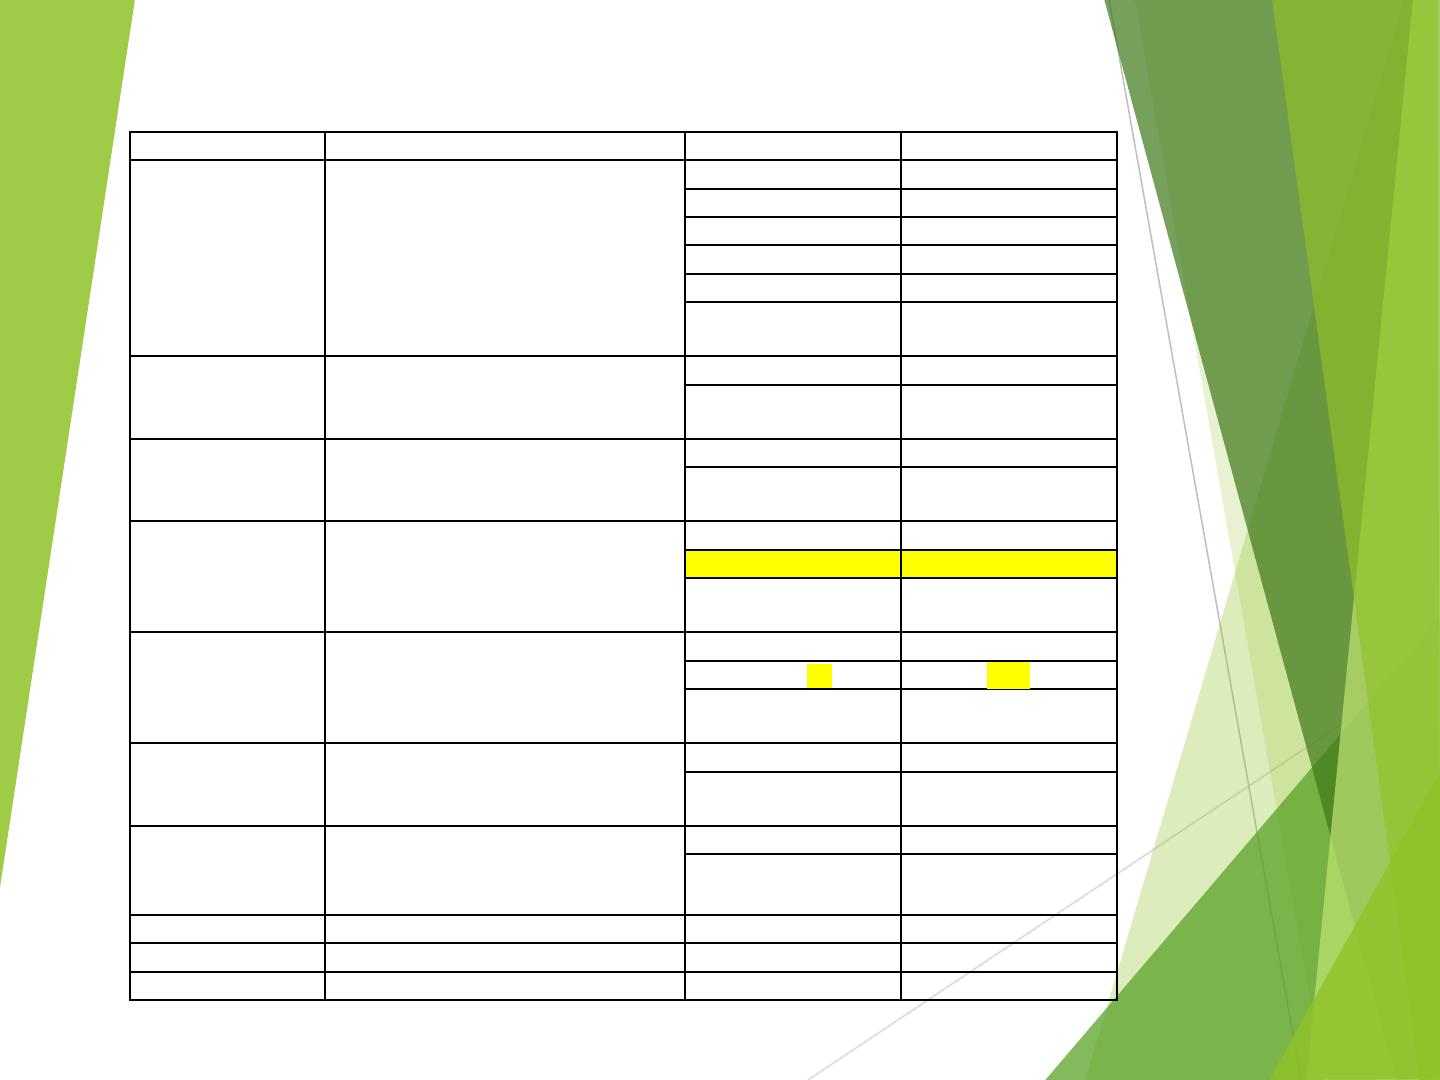
Current Applicable Water Tariff (2015)
7
Item No Category Block ( M
3
) Tariff ( RM)
1 Domestic 1
0 - 10 0.30
11 - 20 0.60
21 - 35 1.10
36 - 60 1.30
➢ 60
1.80
Minimum Charge 7.50
2
Domestic 2 ( Condo with
facilities)
Flat rate 1.30
Minimum charge
150
3
Domestic 3 ( Condo without
facilities)
Flat rate 0.90
Minimum charge
90.00
4 Commercial
0 - 70 1.60
➢ 70
2.00
Minimum Charge 22.50
5 Industry
0 - 70 1.60
➢ 70
2.00
Minimum Charge 70.00
6 Government & Schools
Flat rate 1.20
Minimum charge
30.00
7
Religious & Charitable
Institutions
Flat rate 0.50
Minimum charge
10.00
8 Water Depot Flat rate 3.00
9 Shipping & Ports Flat rate 4.00
10 Emergency Flat rate 0.90
8
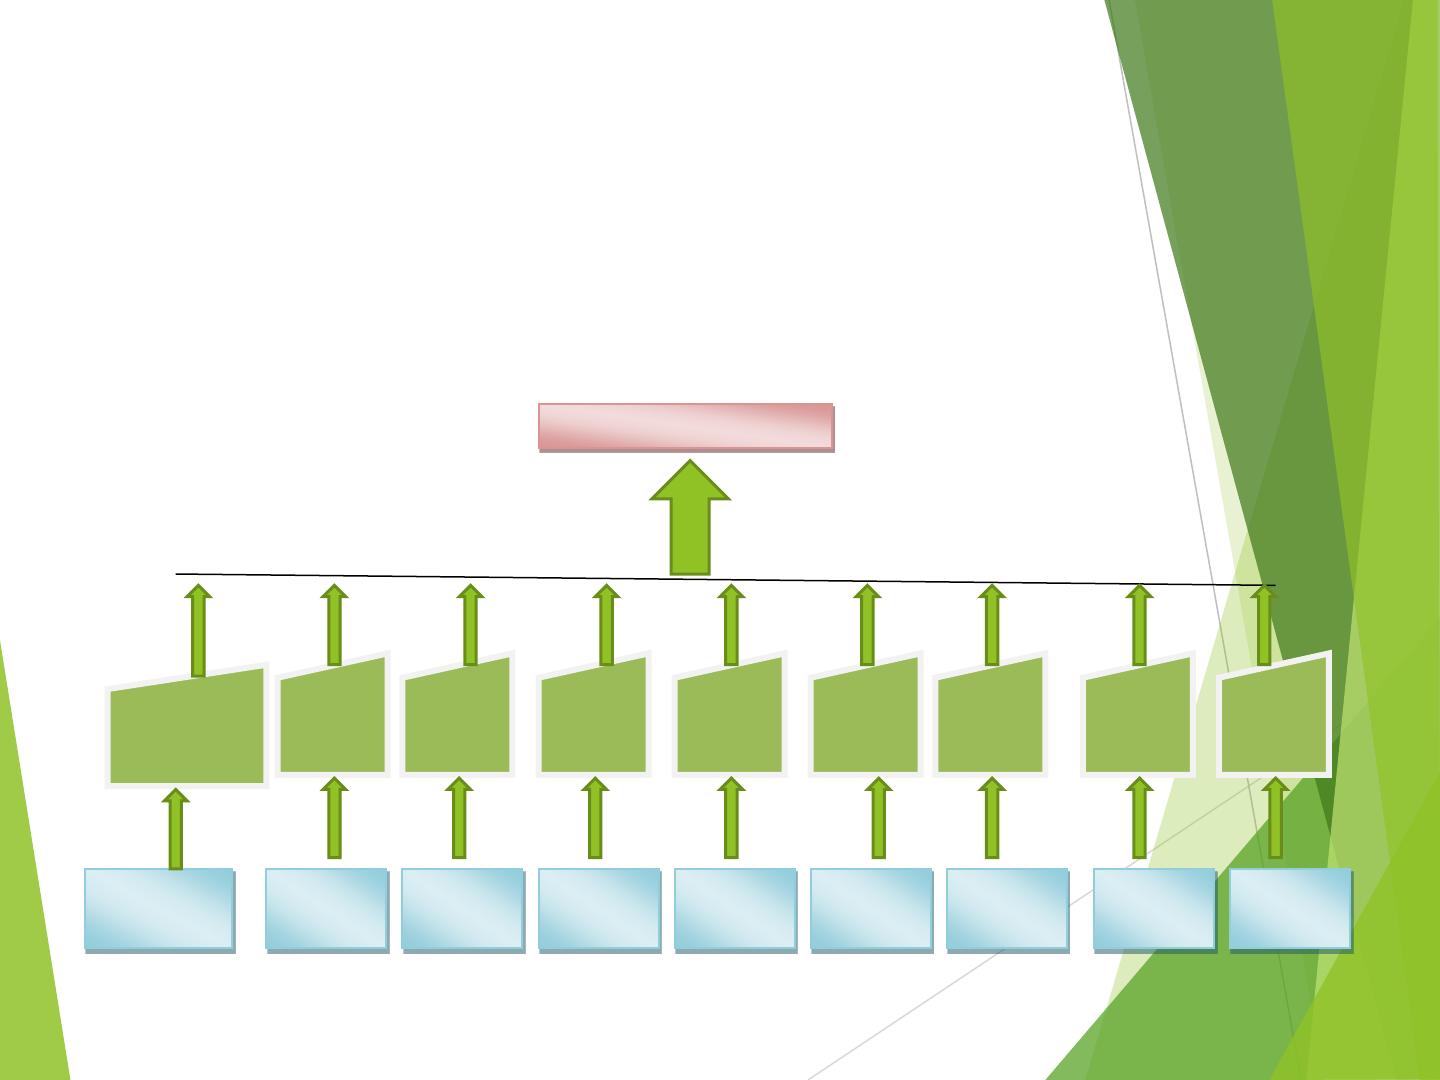
GRAPHICAL PRESENTATION OF THE MODEL
The “Key Control” shown data receive / send from all Divisions for processing ,
it can only be accessed by Committee of Water Supply Authority for important
decision making.
KEY CONTROL
Manual
Data Input
“K” Factors
Manual
Data
Input
Manual
Data
Input
Manual
Data
Input
Manual
Data
Input
Manual
Data
Input
Manual
Data
Input
Manual
Data
Input
Manual
Data
Input
DIVISION
1
DIVISION
2
DIVISION
3
DIVISION
4
DIVISION
5
DIVISION
6
DIVISION
7
DIVISION
8
DIVISION
9
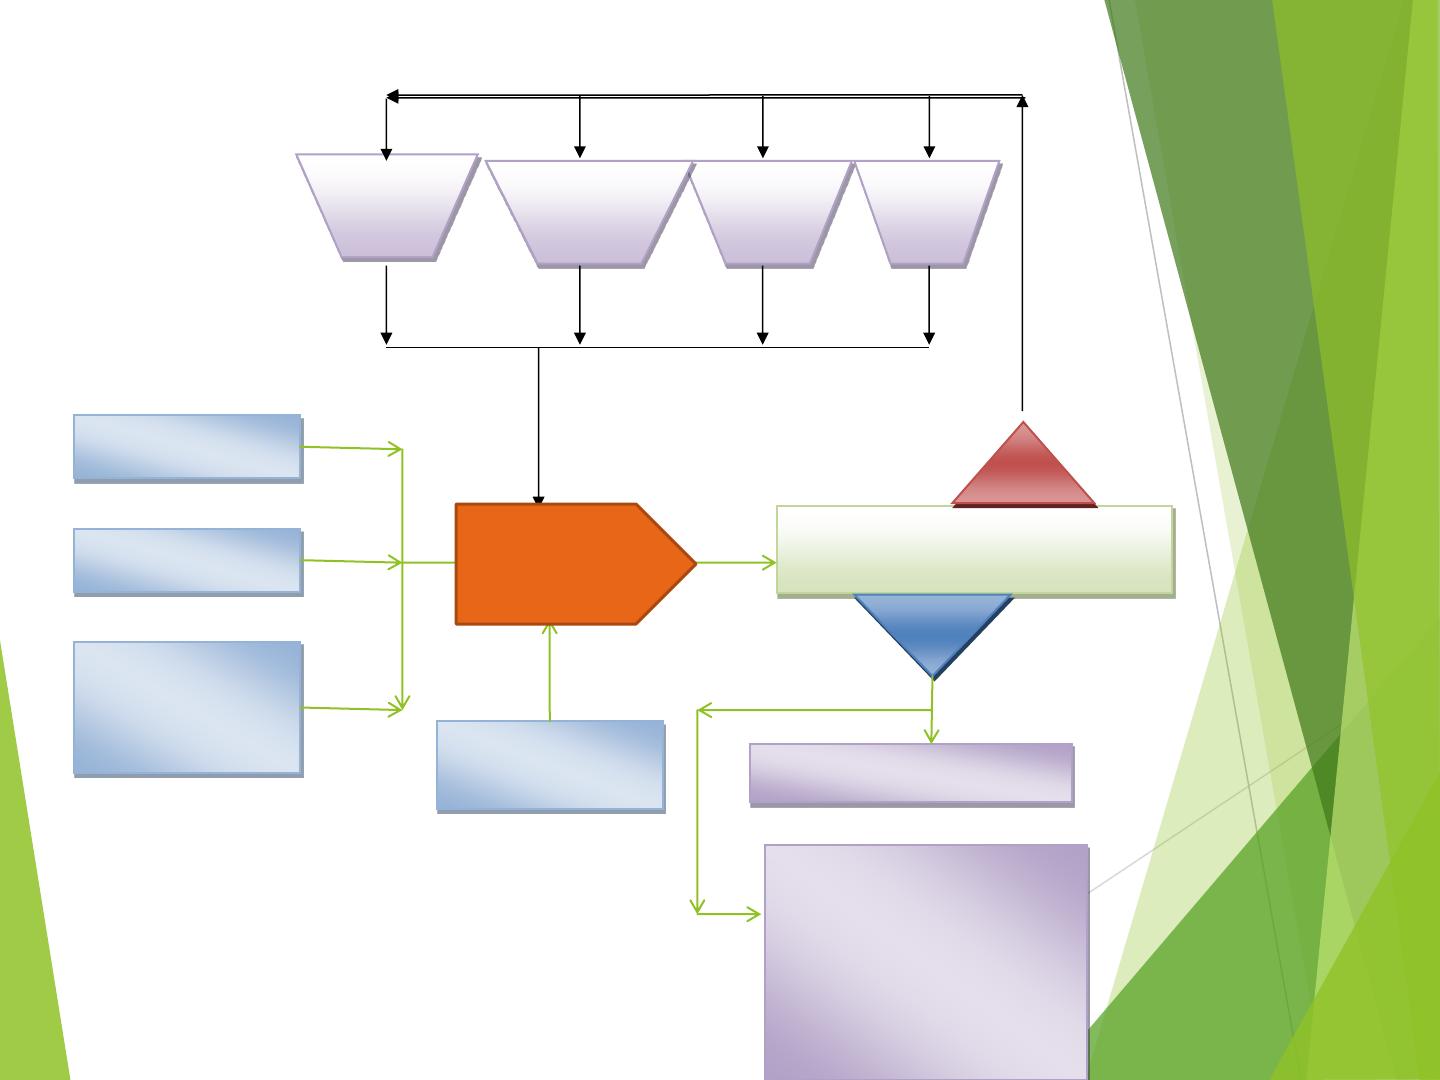
Industry
Domestic
Commercial Bulk
Supply
1 IRR ?
2 NPV>0
3 Operating breakeven Period ?
NO
YES
Government
Subsidize / Financial
Institution
New Water Tariff generated to be
implemented for next 5 years
Performance Scenario
1. Supply Capacity VS Demand
2. NRW
3. Breakeven
4. Consumption Pattern
5.Collection efficiency
6. Current year collection
7. Annual Sales & Collection
GRAPHICAL PRESENTATION OF THE MODEL (Cont)
9
Billing, & Collection
Input “ K “ Factor
Budget, &
Expenditure
Input “ K “ Factor
Production Capacity
Input “K” Factore
Computation
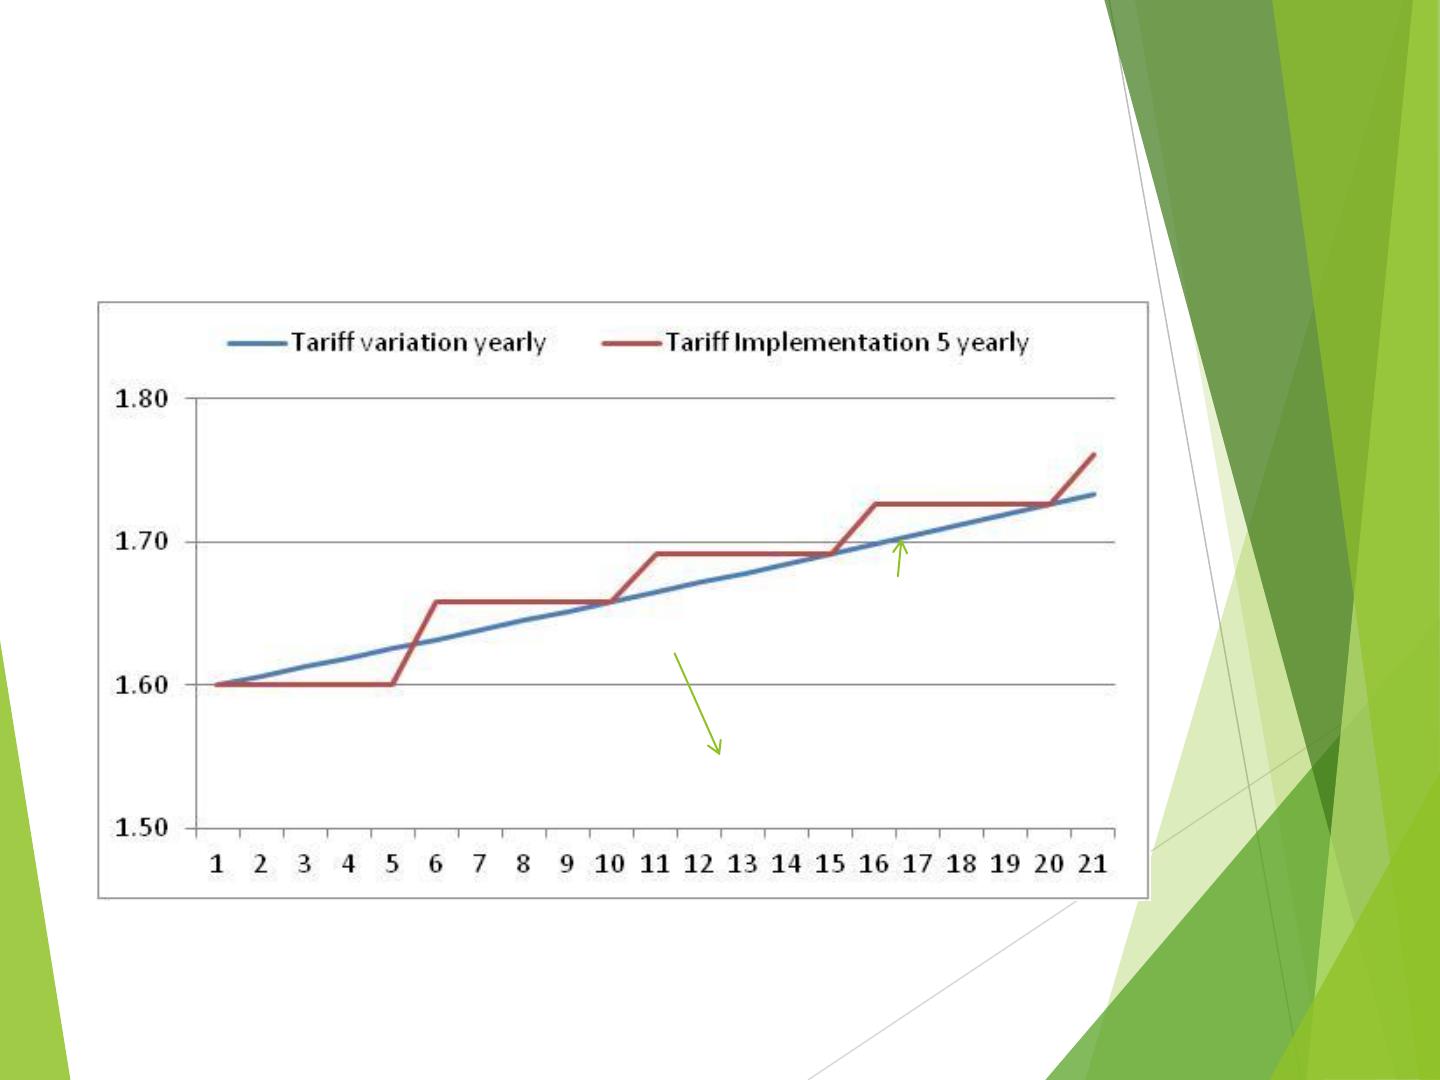
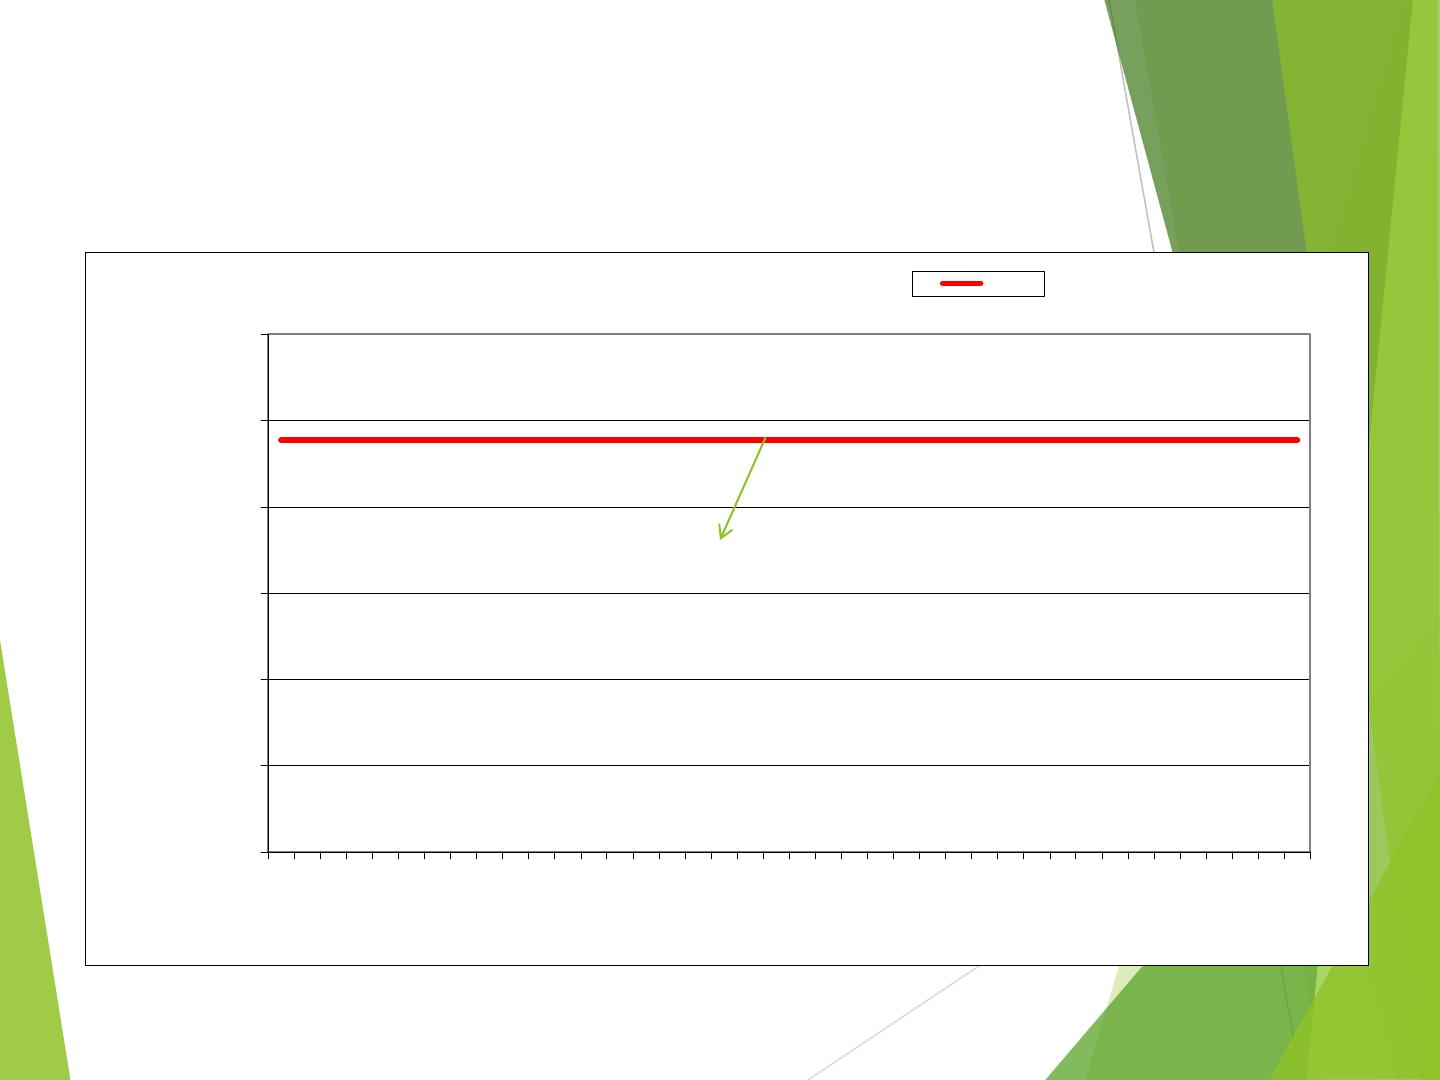
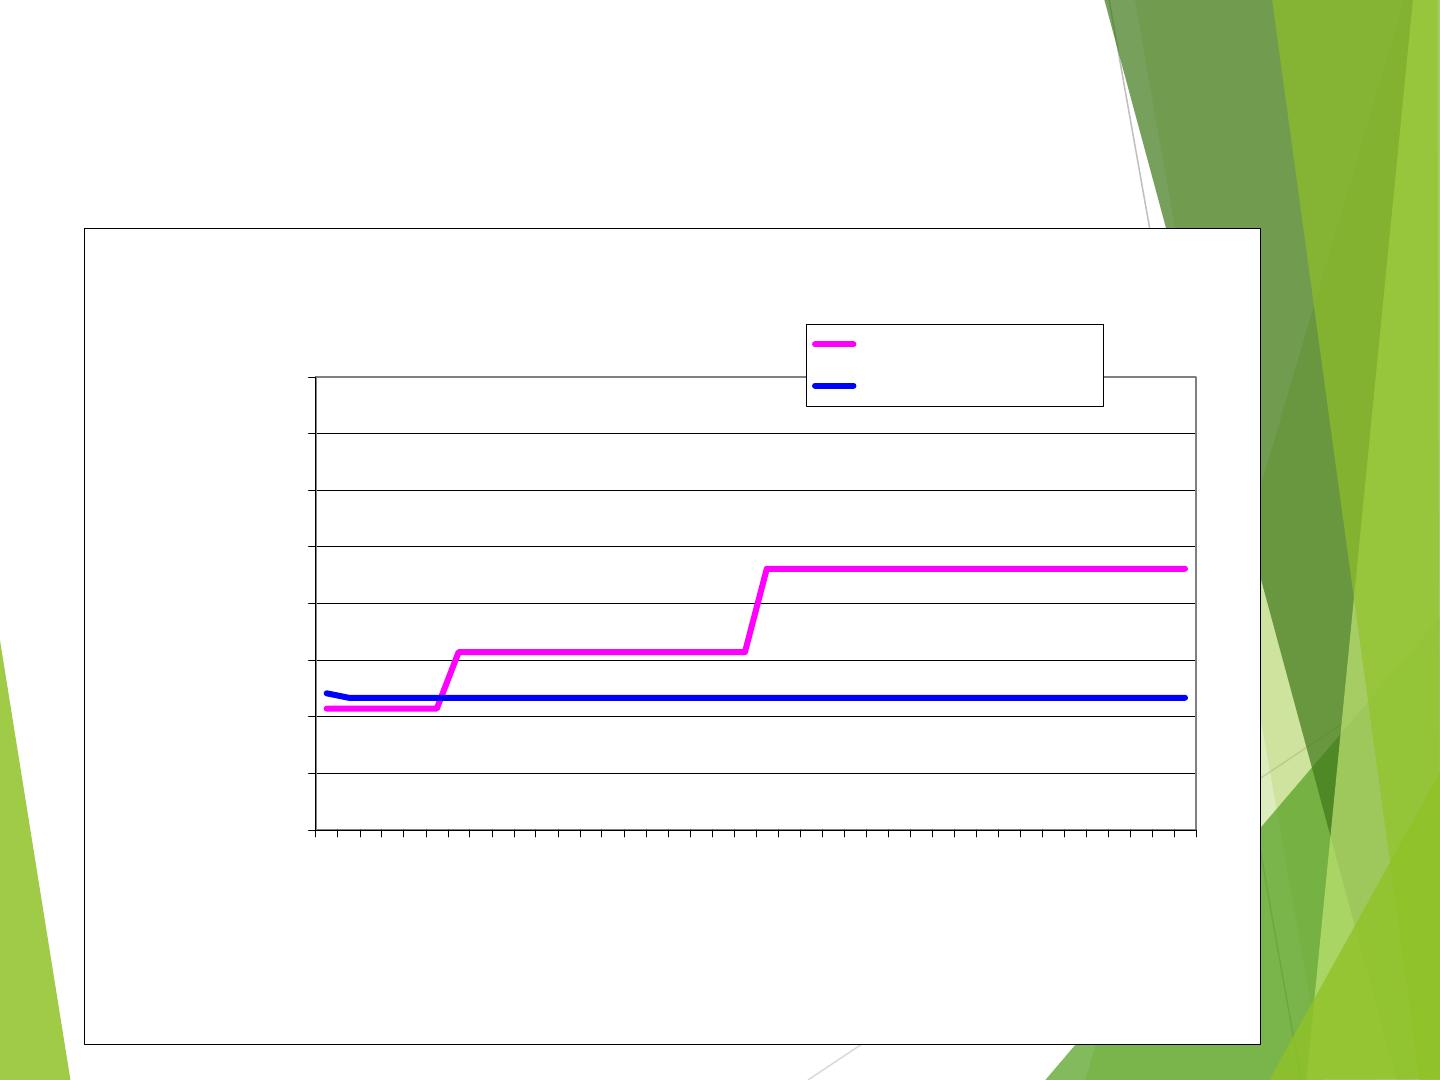
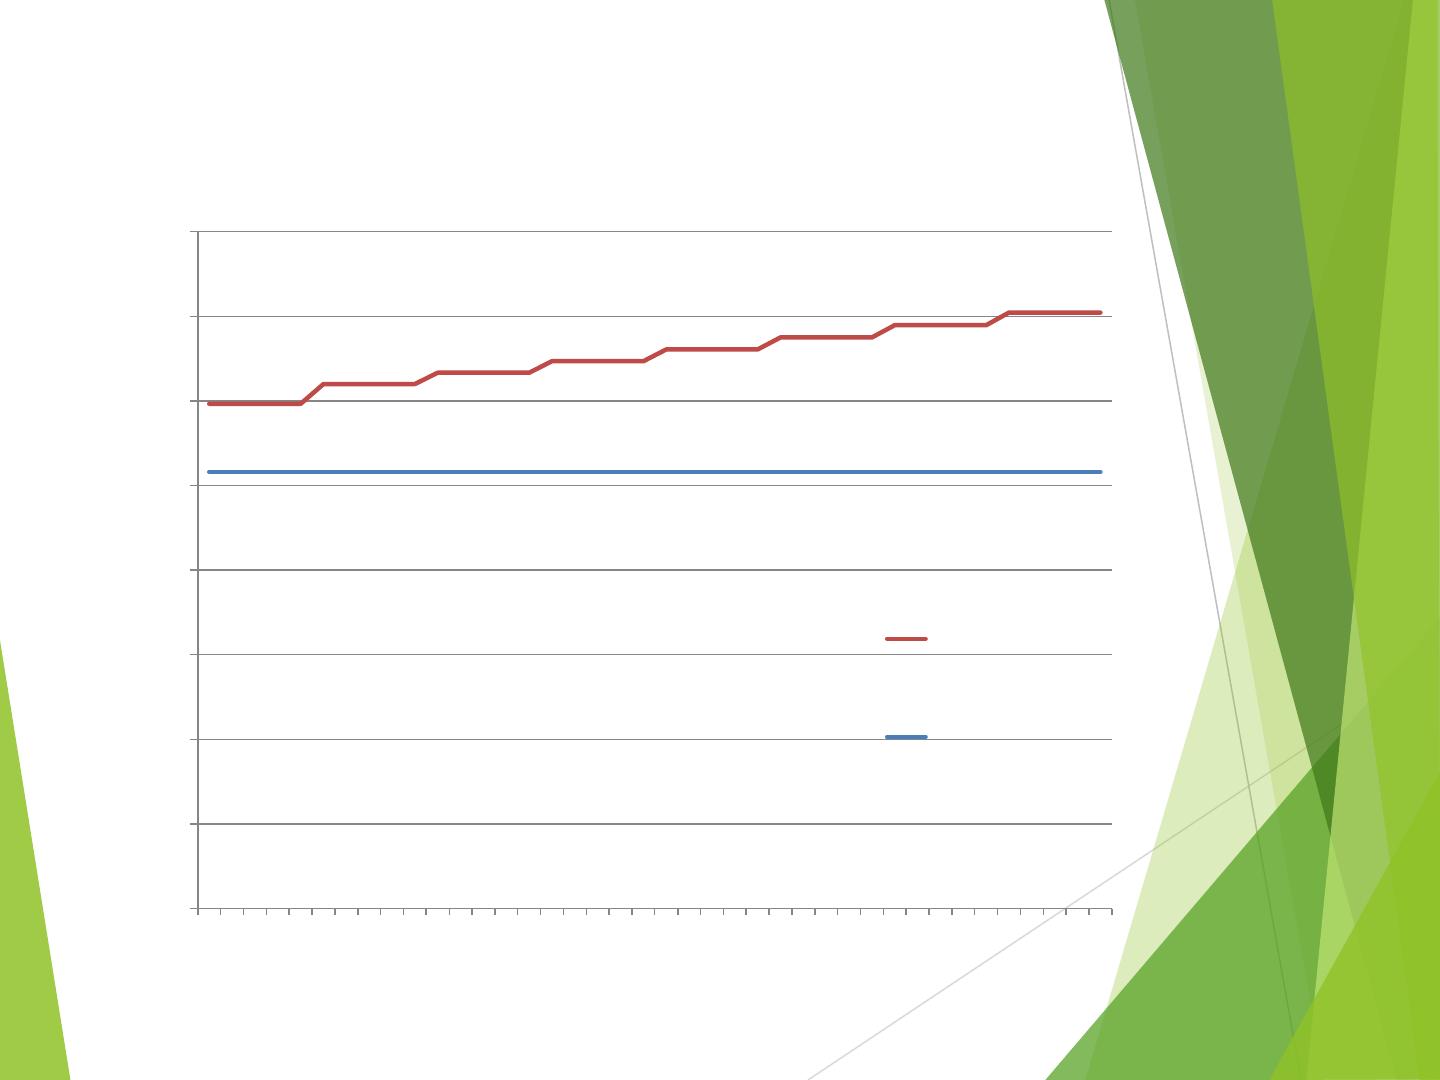
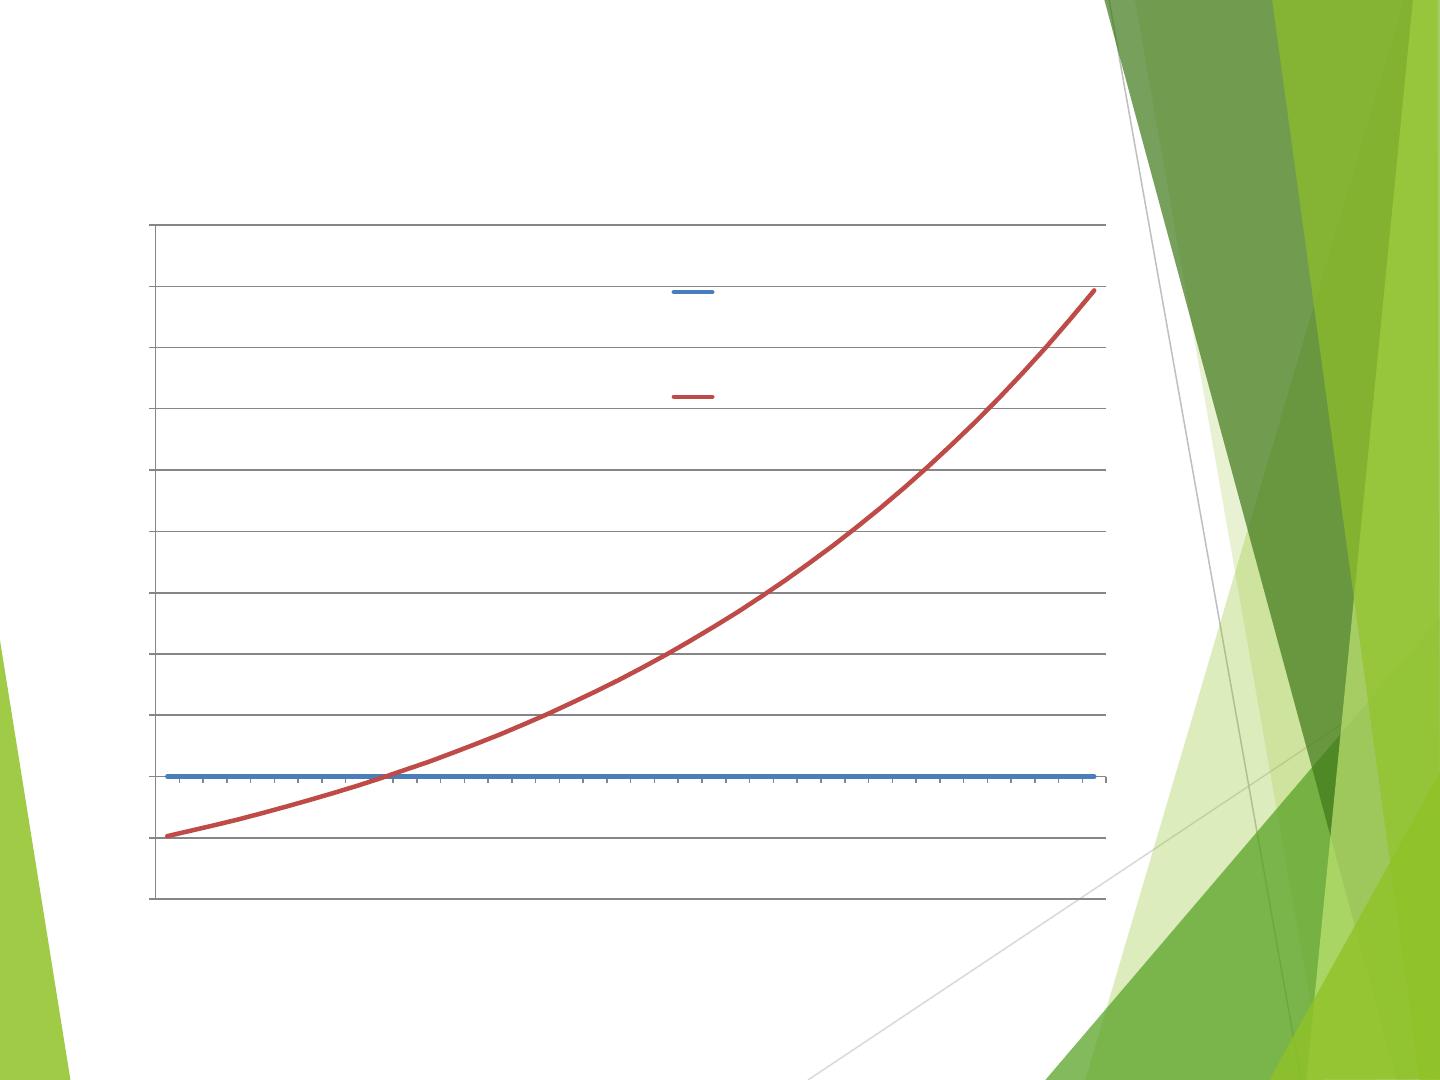
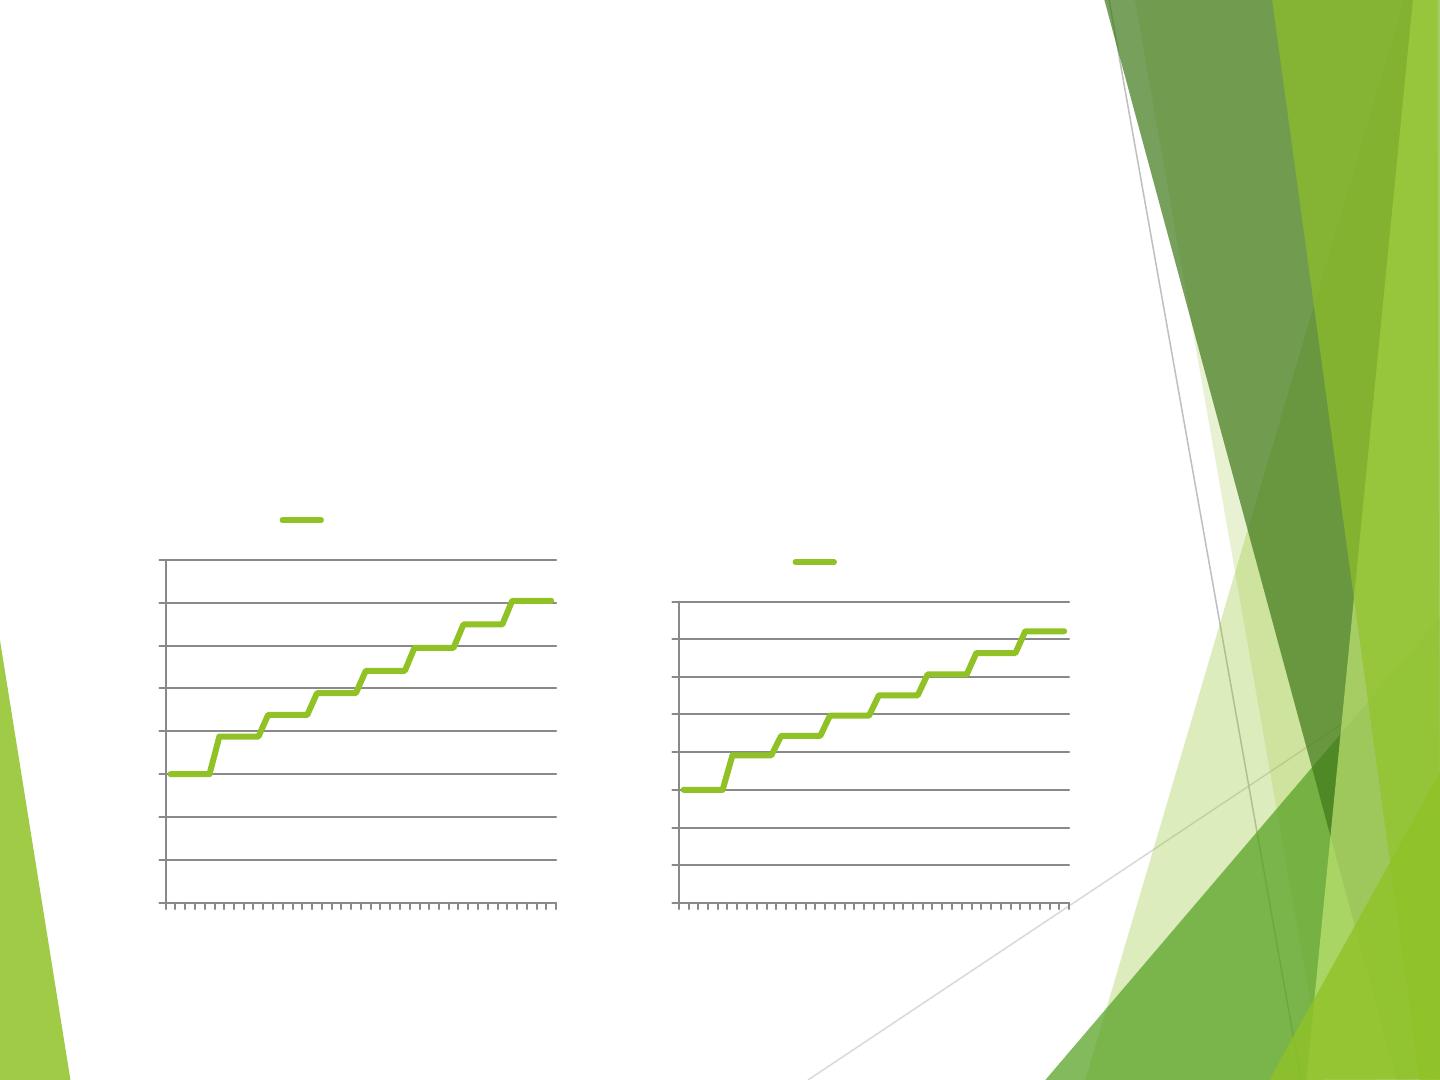
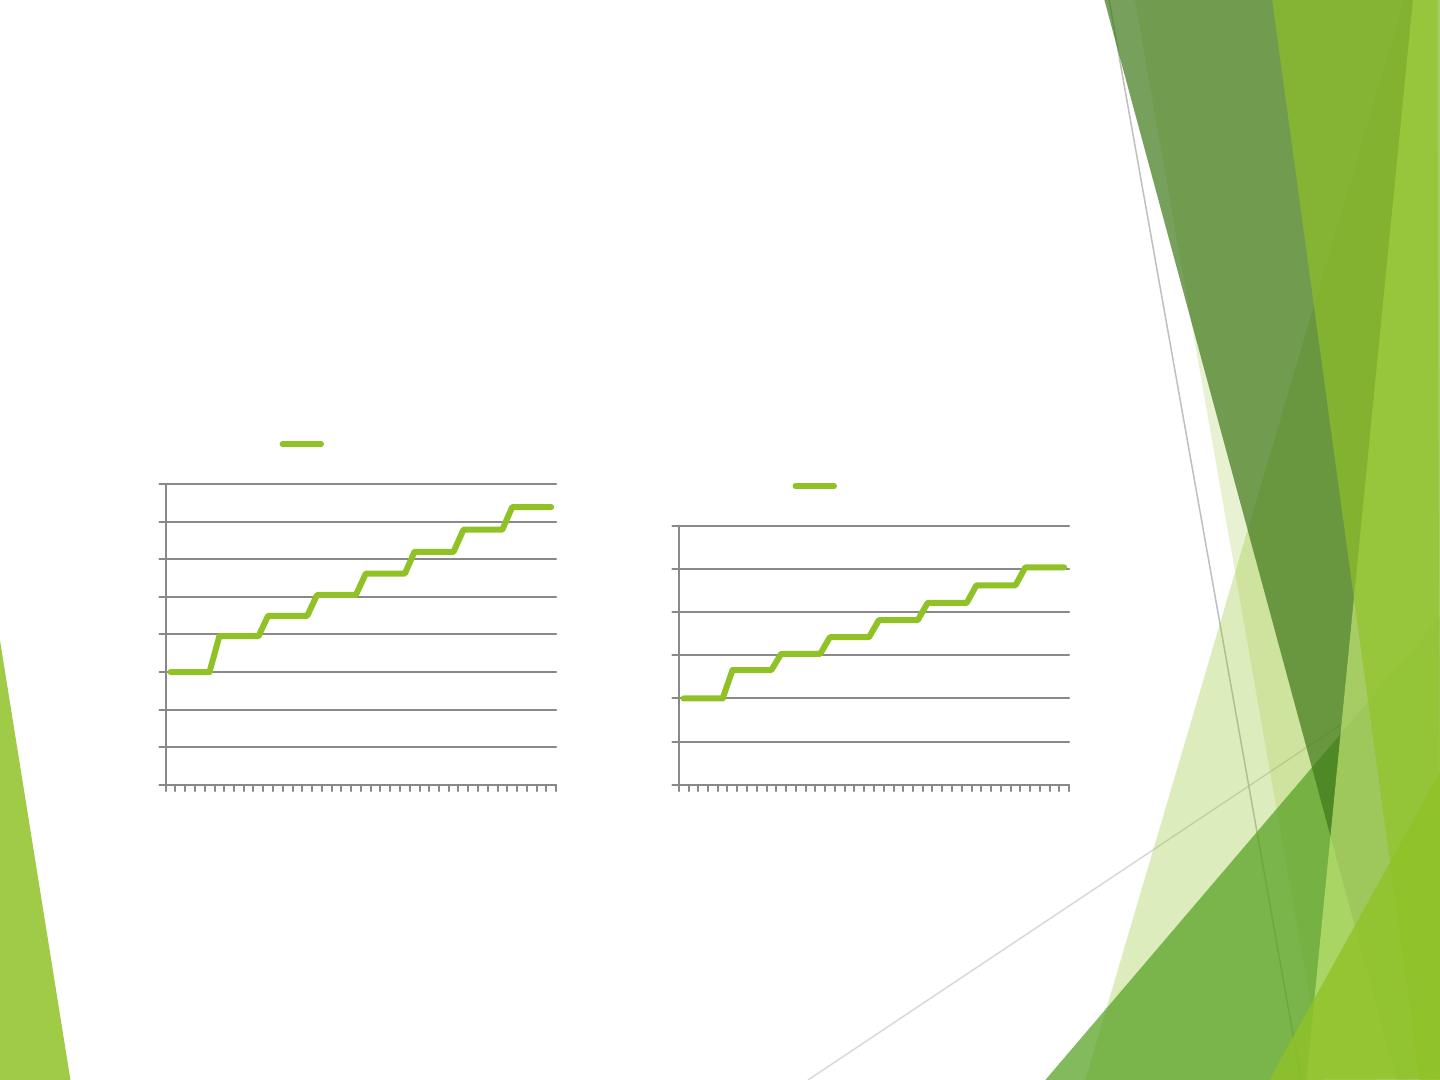
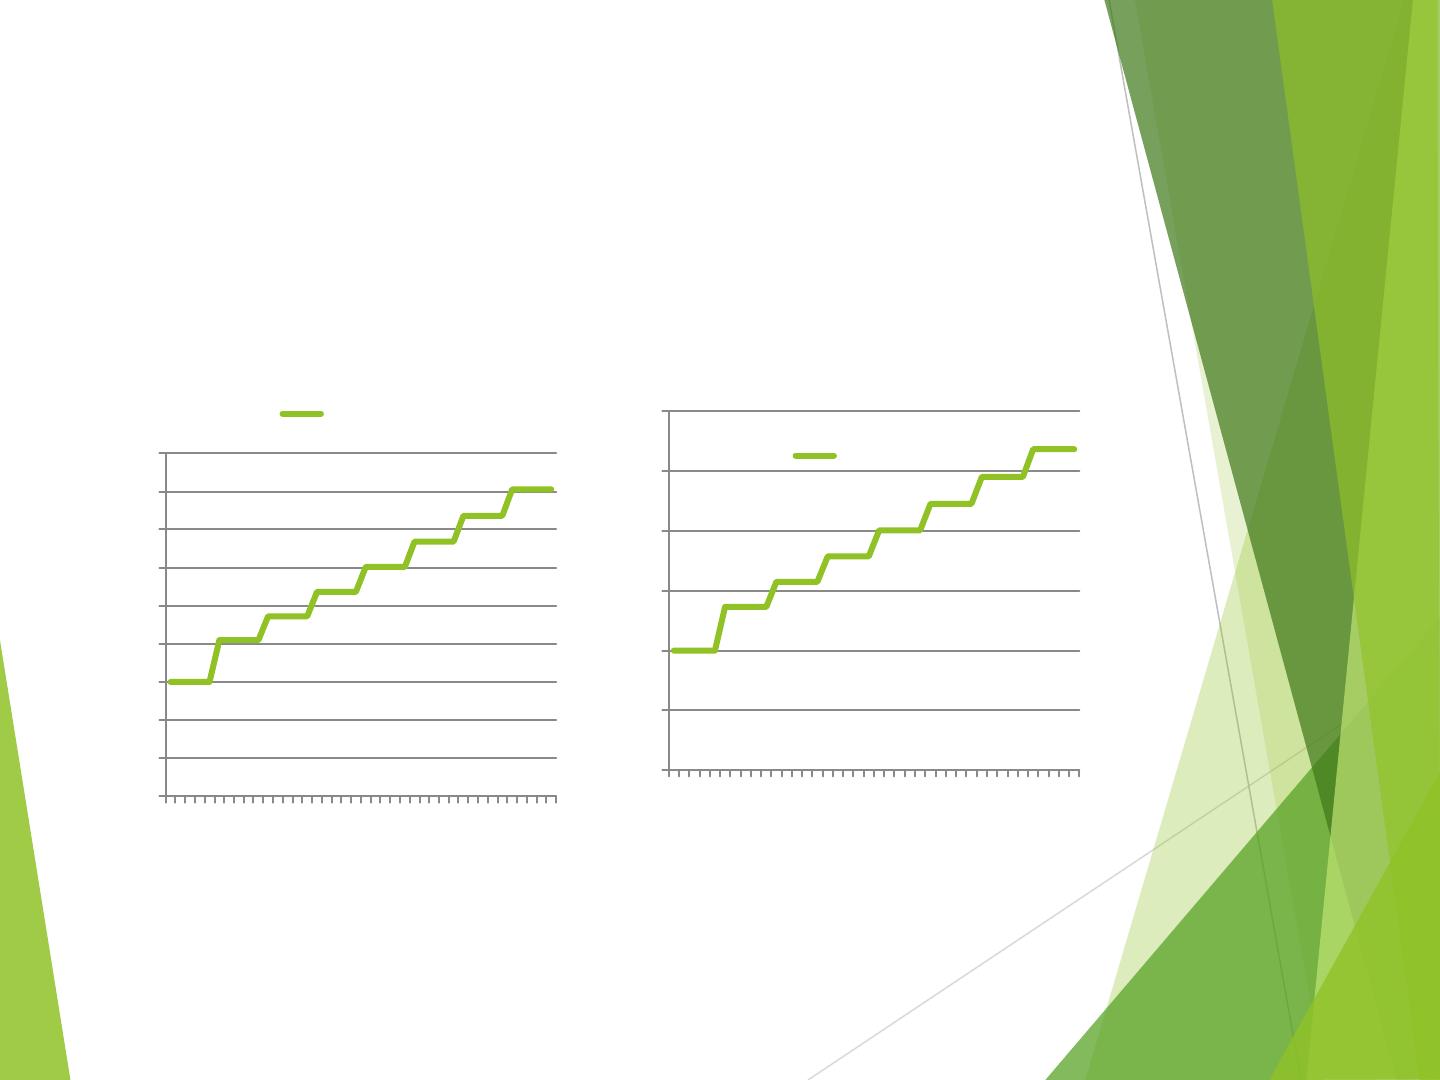
Tariff increase - Rate of tariff increase for each sub-category can be
simulated yearly as shown in the blue line in following graph. The
intersection at every 5 years would be the tariff to be implemented every 5
yearly ( red curve),
10
Tariff review
every 5 yearly
Tariff variation yearly

TIME SCHEDULE OF IMPLEMENTATION
The implementation could be in three stages for each Water Supply
Authority:
1. Phase A – Training and presentation of the Model to Division Operators and
Accounting Central Departments / computer billing section in HQ/Division.
2. Phase B – Calibration of the Financial Model over the last one years and
validate/or estimation of the input data on “K factors” for the Division.
And the decision of the “cut-off” year to run the Model.
3. Phase C – Application of the Financial Model with the latest Drinking Water
Tariff and the Data collected. A report will be generated to reflect the
financial and physical situation of water supply system.
11
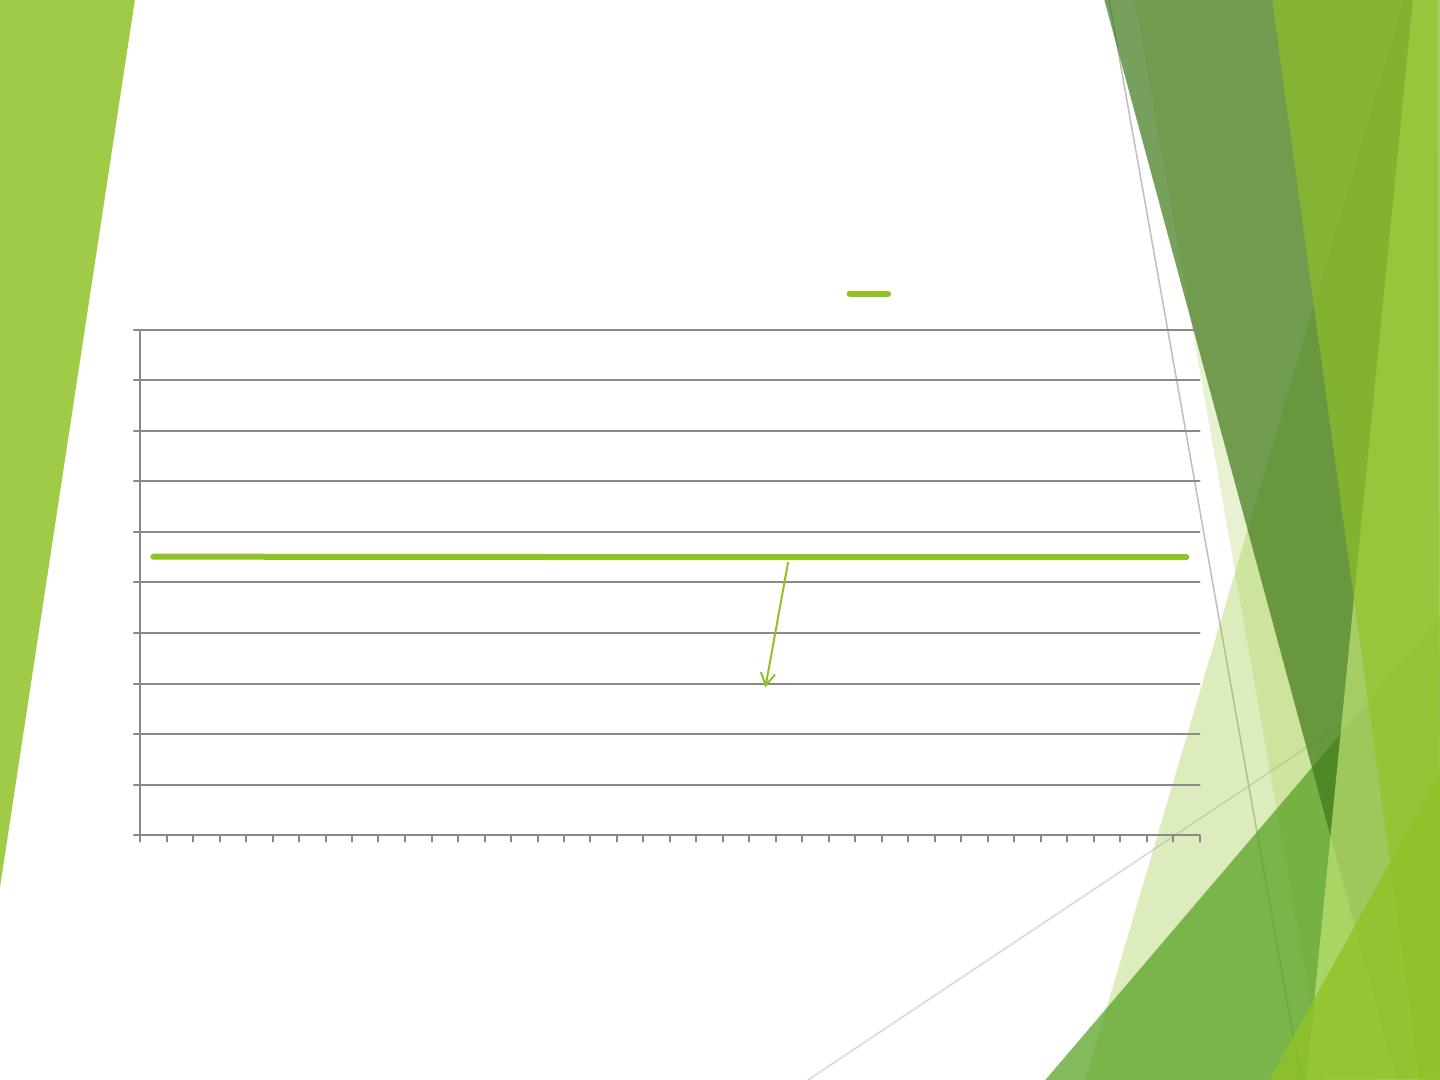
NRW STATUS
0%
10%
20%
30%
40%
50%
60%
1 4 7 10 13 16 19 22 25 28 31 34 37 40
% NRW
Year
NRW
NRW
12
NRW
Supply vs demand
13
200
300
400
500
600
700
800
900
1000
1 2 3 4 5 6 7 8 910111213141516171819202122232425262728293031323334353637383940
MLD
Year
PLANT DESIGNED CAPACITY VS DEMAND
PLANT DESIGNED CAPACITY
The Demand
Collection Efficiency
14
0%
10%
20%
30%
40%
50%
60%
70%
80%
90%
100%
1 2 3 4 5 6 7 8 9 10 11 12 13 14 15 16 17 18 19 20 21 22 23 24 25 26 27 28 29 30 31 32 33 34 35 36 37 38 39 40
Collection Efficiency
Collection…
Collection
efficiency

CONSUMPTION PATTERN
1. Dom 2. Spare 3. Commercial 4. Industry 5. Government &
Educational Institution 6. Religion & Charity 7.Condo with facilities
8. Condo without facility
9. Water Depot 10. Shipping & Ports 11. Emergency
57.7%
0.0%
35.0%
1.0%
1.4%
0.3%
1.4%
0.7% 0.7% 1.1%
0.8%
1st year consumption pattern in pie format
1
2
3
4
5
6
7
8
9
10
11
15
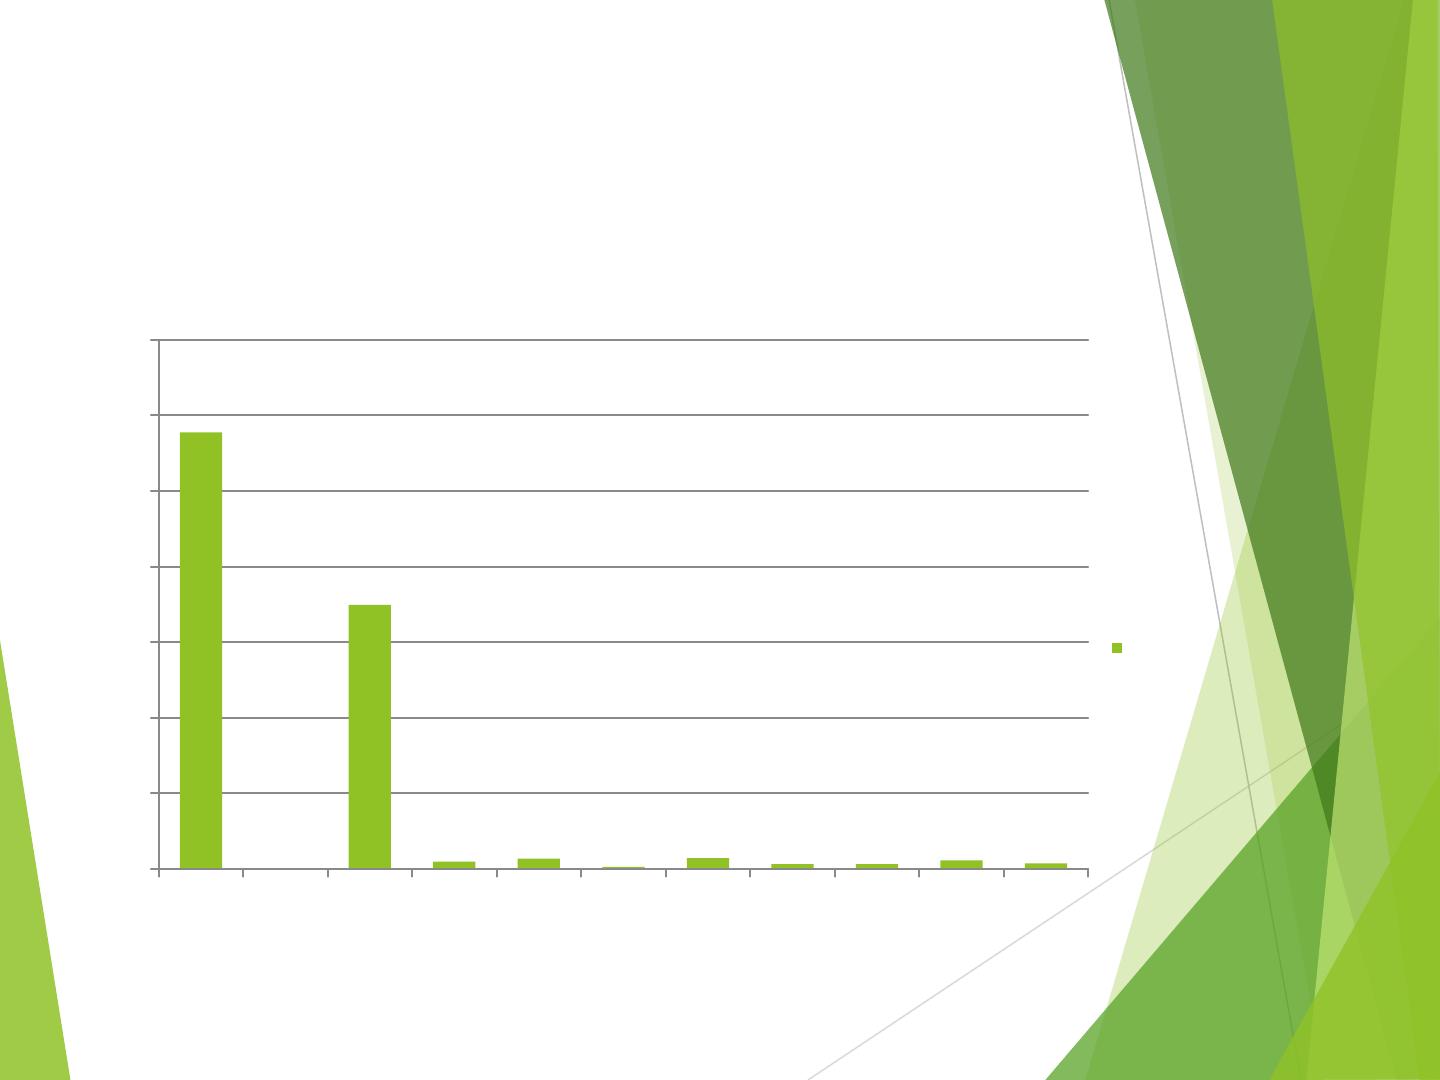
CONSUMPTION PATTERN
1. Dom 2. Spare 3. Commercial 4. Industry 5.
Government & Educational Institution 6. Religion &
Charity 7.Condo with facilities 8. Condo without facility
9. Water Depot 10. Shipping & Ports 11. Emergency
57.7%
0.0%
35.0%
1.0%
1.4%
0.3%
1.4%
0.7%
0.7%
1.1%
0.8%
1 2 3 4 5 6 7 8 9 10 11
0.0%
10.0%
20.0%
30.0%
40.0%
50.0%
60.0%
70.0%
1st year consumption pattern in column format
1st year consumption pattern
16
Total Sales and Collections
17
-
20.00
40.00
60.00
80.00
100.00
120.00
140.00
160.00
1 2 3 4 5 6 7 8 9 1011 1213 1415 1617 1819 2021 2223 2425 2627 2829 3031 3233 3435 3637 3839 40
Millions
Total Sales in
respective yr
Total collection in
respective yr
The breakeven even
18
-20
-10
0
10
20
30
40
50
60
70
80
90
1 2 3 4 5 6 7 8 9 10 11 12 13 14 15 16 17 18 19 20 21 22 23 24 25 26 27 28 29 30 31 32 33 34 35 36 37 38 39 40
Millions
Years
Millions
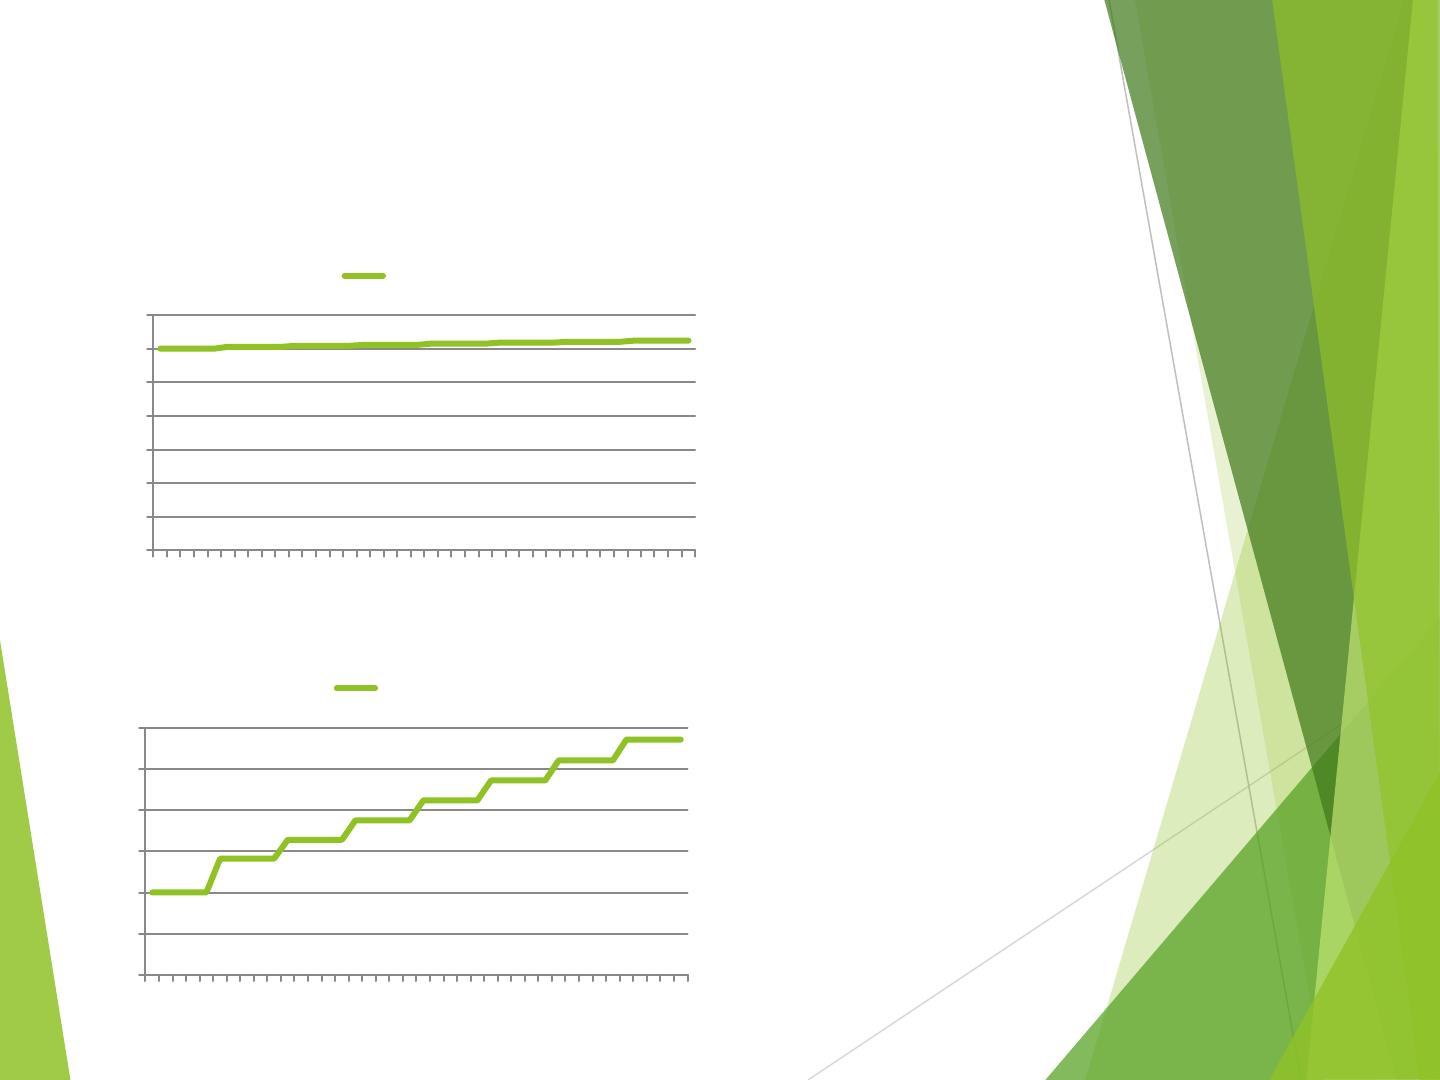
Domestic Tariff Adjustment and Projection
0.00
0.05
0.10
0.15
0.20
0.25
0.30
0.35
1 6 11 16 21 26 31 36
D1 Tariff
D1 Tariff
D2 category
0.56
0.58
0.60
0.62
0.64
0.66
0.68
1 6 11 16 21 26 31 36
D2 Tariff
D2 Tariff
RM
19
RM
D1 category
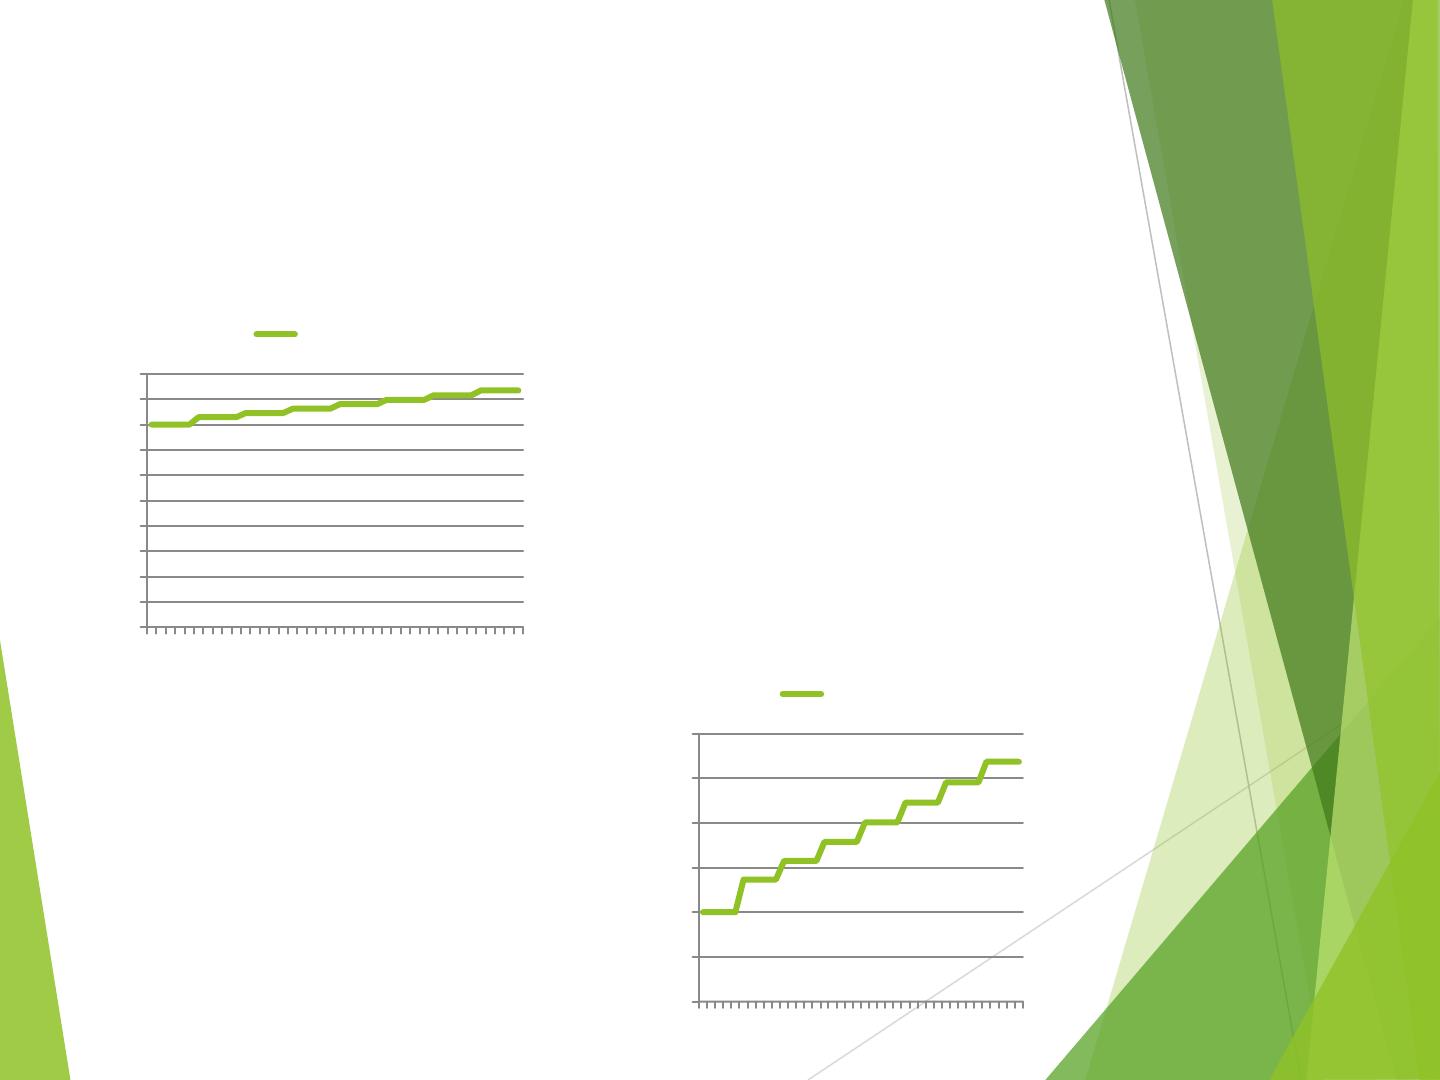
Commercial Tariff Adjustment and
Projection
C 1 Category
0.00
0.20
0.40
0.60
0.80
1.00
1.20
1.40
1.60
1.80
2.00
1 6 11 16 21 26 31 36
C1 Tariff
C1 Tariff
RM
C 2 category
1.80
1.90
2.00
2.10
2.20
2.30
2.40
1 6 11 16 21 26 31 36
C2 Tariff
C2 Tariff
RM
20

Industry Tariff Adjustment and Projection
I 1 Category
1.45
1.50
1.55
1.60
1.65
1.70
1.75
1.80
1.85
1.90
1 6 11 16 21 26 31 36
I1 Tariff
I1 Tariff
I 2 Category
2.00
2.10
2.20
2.30
2.40
2.50
2.60
1 6 11 16 21 26 31 36
I2 Tariff
I2 Tariff
21
Bulk Supply Tariff Adjustment & Projection
B 1 Category Government
1.05
1.10
1.15
1.20
1.25
1.30
1.35
1.40
1.45
1 6 11 16 21 26 31 36
B1 Tariff Government
B1 Tariff
B2 Category Religion &
Charitable
0.44
0.46
0.48
0.50
0.52
0.54
0.56
0.58
0.60
1 6 11 16 21 26 31 36
B2 Tariff Religion &
Charitable
B2 Tariff
22
Bulk Supply Tariff Adjustment & Projection
B3 Category
1.15
1.20
1.25
1.30
1.35
1.40
1.45
1.50
1.55
1 6 11 16 21 26 31 36
B3 Tariff Condo with
Facilities ( Dom 2 )
B3 Tariff
B4 Category
0.80
0.85
0.90
0.95
1.00
1.05
1.10
1 6 11 16 21 26 31 36
B4 Tariff Condo
without Facility (Dom
3)
B4 Tariff
23
Bulk Supply Tariff Adjustment & Projection
B5 Category
2.70
2.80
2.90
3.00
3.10
3.20
3.30
3.40
3.50
3.60
1 6 11 16 21 26 31 36
B5 Tariff Water Depot
B5 Tariff
B6 Category
3.60
3.80
4.00
4.20
4.40
4.60
4.80
1 6 11 16 21 26 31 36
B6 Tariff Shipping &
Ports
B6 Tariff
24
The Billing
No. Meter
Tarikh Bacaan
Penggunaan (m3)
Penggunaan Pm
(m3)
JANH514078
28/08/2023
427 105.00 39.87
JANH514078
10/06/2023
322
Period (Month)
2.6
Block Kegunaan
Unit Per Month
Unit Per Reading Cycle Kadar Amaun
<=10
10 10.00 26.33 0.30 RM 7.90
>11 to <=20
10 10.00 26.33 0.60 RM 15.80
>21 to <=35
15 19.87 52.33 1.10 RM 57.57
>=36 to <=60
25 0.00 0.00 1.30 RM 0.00
> 60
0.00 0.00 1.80 RM 0.00
GST
RM 0.00
Fixed charge/ month
0 RM 0.00
Bill Semasa
RM 81.27
Tunggakan
RM 0.00
JUM.Perlu Dibayar
RM 81.27
25
